TECHNICAL ANALYSIS
Technical analysis aims to forecast the price movement of any tradable
asset that is subject to forces of supply and demand.
Overview
Technical Analysis is quite often used by traders as a fast and easy technique to make an impact on the market. To be realistic, technical analysis is quite opposite to quick and easy. This means that if someone takes this approach as a way to make money fast without studying it before and knowing what this analysis can bring for you, then disappointment is inevitable.
Technical analysis is the observation of historical price behavior in order to find out insights and determine the possible future movements in the markets by using technical indicators, studies, and other specific tools.
Why are decisions based on technical analysis?
Technical analysis is a smart tool which can help you decide not only when to invest and where to invest, but also, when and where to leave the market, so you keep your capital safe.
How can you use technical analysis?
This analysis is based on the theory that the markets are chaotic, which means nobody knows what will happen for sure, but at the same time, price movements are not 100% random. In a few words, the Chaos Theory in mathematics proves that within a state of chaos there are identifiable patterns that tend to repeat.
We can mention here the weather forecast, a type of chaotic behavior. Like the weather forecast, most traders will say that they are not able to predict the exact price movements. As a result, being successful at trading is not being right or wrong. It is about determining probabilities and placing the positions when the conditions are in favor. Determining probabilities includes forecasting the market direction when to enter into action, where to open the positions, and equally crucial is determining risk/reward ratio.
With all we said above, there is no certain formula to unlock the secret of trading strategy. The keys to success are smart risk management plan, self-discipline, and the ability to control emotions. Anyone can guess right and win every once in a while, but without risk management, it is virtually impossible to remain profitable over time.
Bullish and Bearish Flags
Bull flags form after a price spike that peaks out and slowly forms a short-term reversion downtrend. The starting points for the trend lines should connect the highest highs (upper trend line) and the highest lows (lower trend line) to represent the flag portion.
Bear flags form after a large price collapse that attempts a short-term up trend reversion. These are the opposite of bull flags. The trend lines connect the lows and highs starting from the bottom.
5 core steps to getting started with technical analysis:
1. Identify a technical analysis strategy
2. Identify tradable securities that fit with the technical strategy
3. Find the right brokerage account for executing the trades
4. Select an interface to track and monitor trades
5. Identify any other applications that may be needed to implement the strategy
Trading is not an easy task, which means it’s important to learn first, and never stop learning while you trade. Some tips might be:
Understanding the logic behind technical analysis;
Testing trading strategies to see their past performance;
Practicing trading in a demo account before committing real capital;
Pay attention to the limitations of technical analysis to avoid costly failures and surprises;
Being thoughtful and flexible about the scalability and future requirements;
Trying to test what a trading account offers by requesting a free trial;
Starting small in the beginning and expanding as you gain experience.
Trade with us, safe and secure
Negative Balance
Protection
Trade with the most specialized
trading technology in the market.
Segregated
Accounts
Client capital is kept in separate accounts. The company is not able to use your funds for any reason.
Extra Security for
Big Funding
Additional risk management tools and standards to protect your capital up to $ 1 Million.
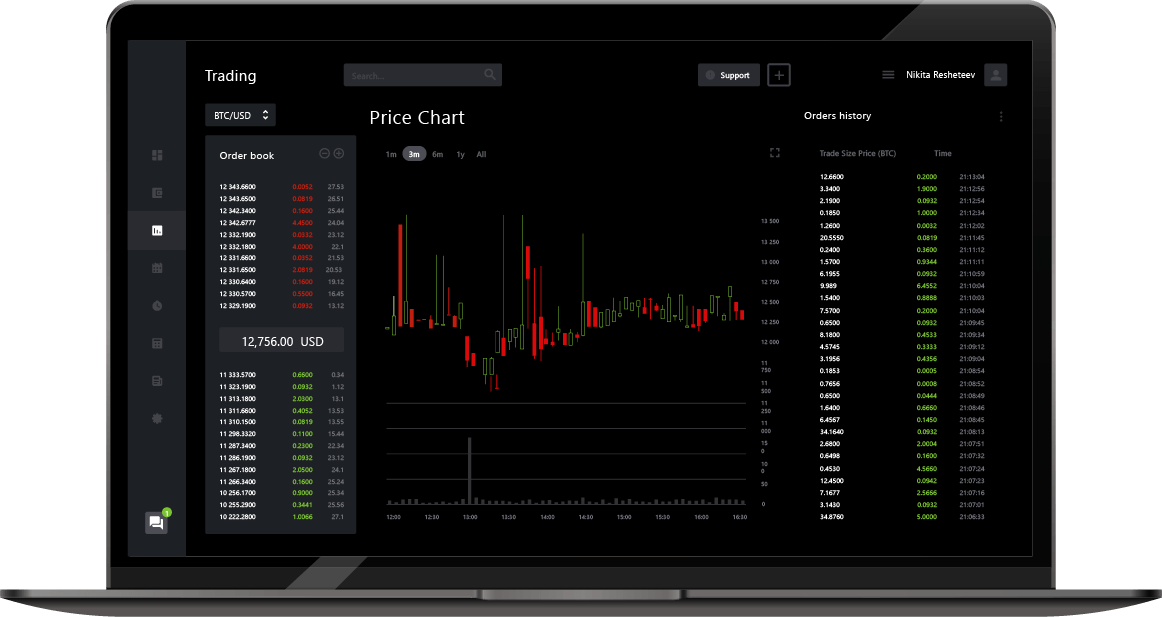
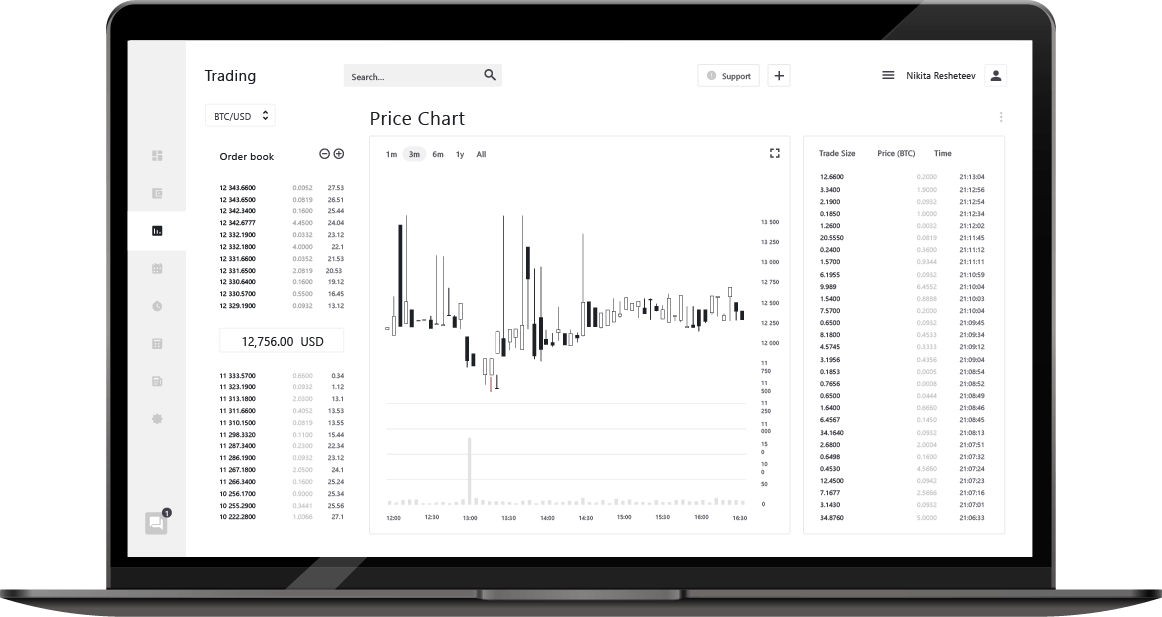
Superbly powerful trading platform
Credibit24 Webtrader
• Market sentiment & technical tools
• Instant trading via Buy and Sell buttons
• Stop loss and take profit functions
• Web-based and mobile compatible
Advanced features
• Advanced interactive charts
• Live data tables for any asset
• 9 charts timeframe (Seconds-Years)
• History data center up to 6 months
• 24/5 technical support
• Different languages available


